1 Capacitor aluminum crystals—definition of orientation and texture
The semi-continuous casting slab, hot-rolled plate, cold-rolled plate or final aluminum foil (Figure 1.7) involved in aluminum electrolytic capacitors are all composed of aluminum crystals. Usually, the normal direction of the aluminum plate or aluminum foil is represented by ND, the rolling direction is represented by RD, and the horizontal direction of the rolled plate or foil perpendicular to ND and RD is represented by TD. Therefore, ND, RD and TD are mutually perpendicular, forming the three directions of the rolled plate coordinate system. Suppose there is a rectangular reference coordinate system 0-RD-TD-ND composed of three mutually perpendicular RD, TD and ND coordinate axes in space. Put the coordinate system of the aluminum crystal into the rolled plate coordinate system in a way of sharing the origin, and the arrangement of its coordinate axes is:
[100] direction is parallel to the RD axis, [010] direction is parallel to the TD axis, and [001] direction is parallel to the ND axis, and the three crystal directions are in the same direction as the RD, TD and ND coordinate axes parallel to them. This arrangement of crystal directions in the reference coordinate system of the capacitor aluminum crystals coordinate system is called initial orientation, represented by e [Figure 1.6 (a)
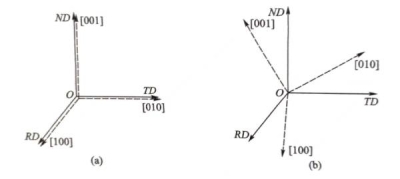
Figure 1.6 Orientation of aluminum crystals; (a) initial orientation e, (b) arbitrary orientation g
A collection of a large number of small crystals gathered together is called a polycrystal, and each small crystal in the polycrystal is called a grain; the finished product of the aluminum foil of electrolytic capacitors is a polycrystal composed of many grains, and the diameter of the grains ranges from ten microns to tens of microns; the grains in the finished product of the high-voltage anode foil are even larger. Figure 1.7 shows the grain aggregation observed in the annealed industrial pure aluminum polycrystal using a polarized light microscope.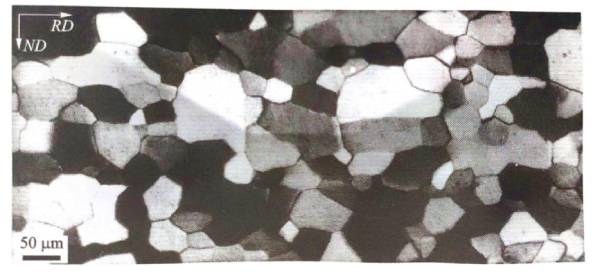
Figure 1.7 Polarized light microscopic observation of industrial pure aluminum polycrystal grains
If an aluminum polycrystal is placed in the coordinate system 0-RD-TD-ND and the orientation of each grain is observed, the <100> direction of each grain coordinate system usually does not have the above arrangement, so they do not have an initial orientation, but only a general orientation, represented by g [Figure 1.6 (b)]. If the crystal coordinate system with the initial orientation is rotated in a certain way so that it coincides with the crystal coordinate system of the observed grain, the rotated crystal coordinate system has the same orientation as the observed grain coordinate system. It can be seen that the orientation describes the rotation state of the aluminum grain 0-[100]-[010]-[001] crystal coordinate system relative to the 0-RD-TD-ND rolling plate coordinate system: the orientation can be used to express the way in which the basic coordinate axes [100], [010], and [001] of the grain are arranged in the rolling plate coordinate system. It is also customary to express the orientation of the crystal by the arrangement of a certain crystal plane and crystal direction of the observed crystal in the reference coordinate system. If a certain (hkl) face of the aluminum grain is parallel to the plane determined by the rolled plate RD-ND, it is called the rolled face, that is, the [hkl] direction is parallel to the ND axis, and a certain -[uvw] direction on the (hkl) face is parallel to the RD axis, then (hkl)[uvw] can be used to express the orientation of the grain. In addition, [rst]=[hkl]x [uvw] is used to represent the crystal direction parallel to the TD axis, so that a standard orthogonal matrix can be formed. Taking the interval g for the crystal, we have: Formula (1.3) can express the orientation of any grain in a cubic polycrystal in the reference coordinate system. For the initial orientation e, we have:

Since the crystal coordinate system can be rotated from the initial orientation consistent with the plate coordinate system [Figure 1.6 (a)] to any orientation through a certain rotation, the crystal orientation can also be expressed by the angle of rotation. A commonly used way to determine the orientation is to express it in Euler angles. Figure 1.8 shows three Euler rotations made in the order of φ1, Φ, and φ2 starting from the initial orientation. Any crystal orientation can be achieved through this rotation, so the orientation g can be expressed as: Obviously, for the initial orientation e, we have:

If the orientation obtained by any (φ1, Φ, φ2) rotation is represented by a matrix, the following relationship can be derived:
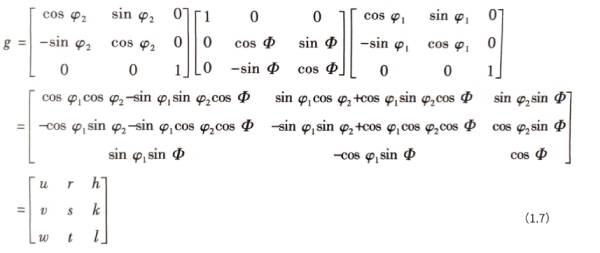

Figure 1.8 Euler rotation of orientation
At this time, the RD axis, TD axis, and ND axis of the plate coordinate system are parallel to [uvw], [rst], and [hkl] respectively (Figure 1.8), thus establishing a conversion relationship between the two orientation expressions. From the orientation shown in formula (1.3), we can see that there are 9 variables in the expression. However, these 9 variables are not all independent, and there are the following 6 normalization and orthogonality constraints:
Usually, the orientations of each grain in a polycrystal are different. If the deflection state of a small cube in the rolling plate coordinate system similar to that shown in Figure 1.3 is used to represent the grain orientation, the distribution state of the orientation of each grain in the polycrystal is shown in Figure 1.9 (a). When the orientations of a large number of grains in a polycrystal become consistent, a texture phenomenon will appear in the polycrystal. As shown in Figure 1.9 (b), many grains in a polycrystal plate have similar orientations, that is, there is a texture in the polycrystal. It is generally believed that when many grain orientations are concentrated near one or some orientation positions, it is called a preferred orientation. The preferred orientation structure of a polycrystal is called a texture. Texture phenomena are inevitable in the production and processing of aluminum polycrystals. The texture in aluminum polycrystal can be expressed by the family of crystal planes and crystal directions {hkl}<uvw>, that is, the {hkl} planes of many grains are parallel to the rolling plane, and at the same time, these grains have <uvw> directions parallel to the rolling direction. Table 1.3 shows some textures that often appear in the production process of electrolytic capacitor foil, in which the crystal plane and crystal direction index of the orientation or texture and the Euler angle can be converted with the help of formula (1.7). In the aluminum rolled plate coordinate system shown in Figure 1.9, after rotating each orientation 180° around the normal, transverse, and rolling direction of the rolled plate, another 3 different orientations can be obtained, including the orientation itself, for a total of 4 different orientations, but they all belong to the {hkl}<uvw> orientation family, so they are called variant orientations of the orientation. For some special orientations, the orientation itself may remain after rotation, such as the {001}<100> orientation; or there may be only two variants in total, such as the {112}<111> orientation. The number of variants of each typical orientation is also listed in Table 1.3.
Table 1.3 Orientation characteristics of some textures that often appear in electrolytic capacitor foil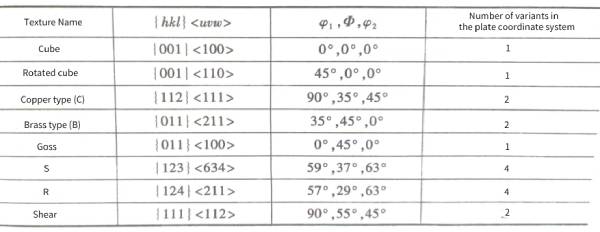
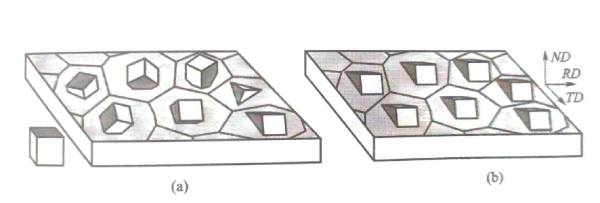
Figure 1.9 Capacitor Aluminum Crystals-Texture phenomenon in aluminum polycrystals
The above is the definition of capacitor aluminum crystals-orientation and texture
2 Capacitor Aluminum Crystals- Polar projection stereogram
Take the RD, TD, and ND rectangular coordinate systems as the plate rolling coordinate system, and make a sphere with a radius of 1 unit length with the origin of the coordinate system as the center. Place the grains of a certain orientation at the origin of the sphere of the coordinate system, and make the normals of all the crystal faces of the {hkl} face family of the crystal, intersecting the sphere at several points to form a spherical projection diagram. The number of projection points of any {hkl} face family on the upper hemisphere should be consistent with the number of non-parallel crystal faces in the crystal orientation family, as shown in Table 1.2.
Figure 1.10 (a) shows the projections of all three crystal face normals in the {100} crystal face family of a crystal, points 1, 2, and 3. Then make a polar projection of these projection points, so that they have a set of intersections with the circular plane (i.e., the equatorial plane) perpendicular to the plate normal and passing through the center of the sphere, as shown in Figure 1.10 (b) at points 1′, 2′, and 3′. Assume that the positive intersection of the ND direction and the sphere in the rolling plate coordinate system is the N pole, and the reverse intersection is the S pole. Then the projection line is the line connecting the intersection points of the projections on the upper hemisphere and the S pole of the lower hemisphere in Figure 1.10 (a). Generally, a {hkl} crystal plane normal has one intersection point on each of the upper and lower spheres. In Figure 1.10 (b), only the group of points in the upper hemisphere is taken for polar stereographic projection. The projected stereographic figure is the polar stereographic projection figure or pole figure expressing the crystal orientation. Figure 1.10 (c) is the corresponding {100} pole figure. Figure 1.10 describes the formation process of the {100} pole figure expressing the crystal orientation. Figure 1.11 shows the projection process of obtaining a {111} pole figure of a crystal orientation. One orientation has 4 projection points on the {111} pole figure (Table 1.2). A similar process can be used to obtain the {110}, {112} or any {hkl} pole figure expressing the crystal orientation. The positions of the points on the pole figures shown in Figures 1.10(c) and 1.11(c) can be represented by angles a and B. Angle a represents the angle between the normal direction of the {hkl} crystal plane and the ND direction of the plate coordinate system, and angle B represents the angle of rotation of the normal direction of the {hkl} crystal plane around the ND direction。
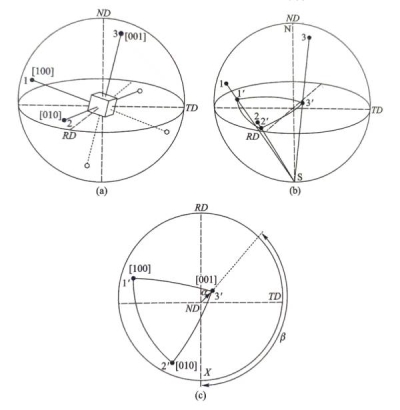 Figure 1.10 Capacitor Aluminum Crystals- Principle of {100} pole figure projection of crystal orientation
If all the grains in a polycrystal are projected as above, many projection points will be obtained on the sphere. The grain volume represented by each point is used as the weight of this point, and the weighted density distribution of these points on the sphere is called the polar density distribution P. Usually, the projection distribution diagram of the polar density distribution on the spherical surface on the equatorial plane is called the polar figure of the polycrystal. As shown in Figure 1.12, on the spherical surface with a radius of 1, the polar density distribution p is a function of the two angles a and B, that is, p=p(a,B). According to the projection relationship in Figure 1.12, the distance from the projection point marked on the polar projection equatorial plane shown in Figure 1.10 (c) and Figure 1.11 (c) to the center of the equatorial plane, that is, the polar diameter ap. is tan(a/2), but it is directly marked as α in actual representation.
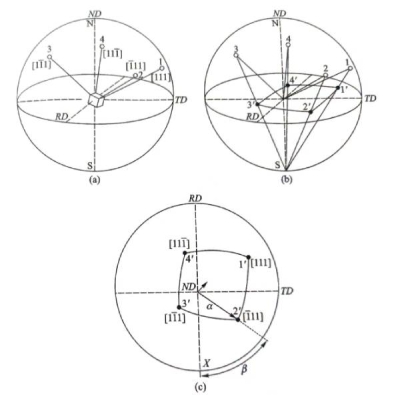
Figure 1.11 Capacitor Aluminum Crystals-Principle of {111} polar figure projection of crystal orientation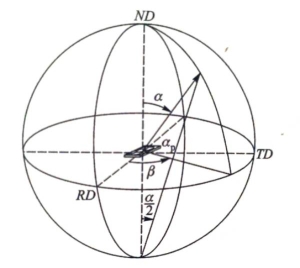 Figure 1.12 Capacitor Aluminum Crystals- Polar density distribution function p=p(a,B)
If there is no texture in the polycrystal, the pole density distribution will be uniform on the entire sphere, and all pole density values are 1. On the contrary, the pole density distribution is uneven on the pole figure, and the pole density values in some places will be relatively high; the pole density values displayed are all multiples of the pole density values without texture. According to the height of the pole density distribution, the pole figure density distribution after the stereographic projection can be obtained. Then, according to the fluctuation range of the specific pole density value, the isodensity lines are drawn to make the pole figures usually used for texture analysis. Figure 1.13 shows the {200} and {111} pole figures of the hot-rolled aluminum plate texture in the production process of electrolytic capacitor anode aluminum foil. Among them, the {200} pole figure is equivalent to the {100} pole figure, but the detection principle requires it to be expressed as a {200} pole figure. According to the distribution of the pole density distribution function peak, it can be analyzed that there are {001}<100>, {124}<211>, {011}<100> and other textures in the aluminum plate. The {001}<100> and {124}<211> textures are often concerned and reported in the literature in the finished electrolytic capacitor anode aluminum foil. Sometimes the {124}<211> texture is expressed as the {123}<634> texture, and the two are very close in the pole figure.

Figure 1.13 Texture of hot-rolled aluminum plate: (a) {200} pole figure (highest density: 14.5); (b) {111} pole figure (highest density: 10.8)
(Density levels: 1, 2, 4, 7, 10; RD: rolling direction. ■: {001} <100>; ●: {124} <211>; 口: {011} <100>
According to the projection principle of pole figures, the geometric relationship between crystal orientation or polycrystalline texture and the rolled plate coordinate system can be directly imagined based on the information provided by the pole figures. However, when using pole figures to express orientation and texture, it is necessary to use multiple points or multiple pole density peaks of the pole figure to express a certain orientation or texture. When there are multiple textures in a polycrystalline, the distribution of the pole density peaks of each texture will overlap or interfere, which brings certain difficulties to the texture analysis. As shown in Figure 1.13 (a), one projection point of the orientation {001} <100> and the orientation {011} <100> on the {100} pole figure coincides. When it is changed to the {111} pole figure [Figure 1.13 (b)], the orientation {001} <100> coincides with the orientation {124} <211> at one point, and the orientation {124} <211> coincides with another point of the orientation {011} <100>, and the proportion of each texture in the same pole density value cannot be distinguished. When there is only one texture in a polycrystal, the pole figure will show its advantage of directly expressing geometric relationships. For example, when there is only {001}<100> texture in high-voltage anode aluminum products, it is more convenient to express and analyze with pole figures.
According to the pole figure shown in Figure 1.13, if the pole figure is rotated 180° around the rolling direction RD, transverse direction TD, and normal direction ND (Figure 1.10, Figure 1.11), the distribution of pole density on the pole figure before and after the rotation remains roughly unchanged, that is, when the texture is expressed in the rolling plate coordinate system, the three directions of RD, TD, and ND have secondary rotational symmetry. The same symmetrical distribution of the deformation load acting on the rolling plate during the rolling process causes this symmetry of the rolling plate texture.
The above is the explanation of capacitor aluminum crystals-polar projection diagram
3 Orientation distribution function
By establishing a function of three independent variables φ1, Φ, φ2, namely, the orientation distribution function, the orientation distribution problem of polycrystalline in three-dimensional space can be expressed; this method overcomes the disadvantage that pole figures need to use multiple points to express an orientation or texture. The orientation density when the orientation is completely randomly distributed is 1, that is, f(g)=1. Therefore, the orientation distribution function value represents the multiple of the orientation density relative to the orientation random distribution density. Using modern diffraction technology, the orientation distribution function of polycrystalline materials can be obtained by measuring pole figures and corresponding calculations. The range of the orientation Euler angles φ1, Φ, φ2 is 0≤φ1,≤2π, 0≤Ф≤π, 0≤φ2,<2π. Using φ1, Φ, φ2 as three variables of the spatial rectangular coordinate system, an orientation space can be established. The range of this orientation space is 2π x π x 2π. However, due to the rotational symmetry of aluminum crystals and the plate itself, the same orientation distribution function value will appear repeatedly in the Euler angle value space. Therefore, the Euler angle value space can be greatly compressed to the range of 0 ≤φ1, ≤ π /2, 0≤ Ф< π /2, 0≤ φ2, < π/2 according to various rotational symmetries. Since there is also 3-fold rotational symmetry in aluminum crystals, each orientation will still appear 3 times in this compressed orientation space.
In order to facilitate the analysis of the orientation distribution function, people often draw the orientation distribution function value on a plane diagram. For rolled pure aluminum, the drawing method is usually perpendicular to the φ2 angle coordinate axis direction of the orientation space, intercepting a series of equally spaced orientation planes at 5° intervals from the orientation space angle, and then drawing the equal density lines of the orientation distribution function value on each orientation plane, thereby obtaining a graphical expression of the orientation distribution function. Of course, if necessary, you can also intercept a series of cross-sections with equal φ1 or Φ.
Taking the orientation distribution function of high-purity aluminum plate as an example, a series of cross-sectional images shown in Figure 1.14 (a) can be obtained perpendicular to the direction φ2 and at an angle of 5°. The figure also indicates the locations where some common orientations or textures in aluminum plates given in Table 1.3 appear. In this series of cross sections, Figure 1.14 (b) and Figure 1.14 (c) respectively show the orientation distribution functions measured on high-purity aluminum cold-rolled aluminum plate and annealed aluminum foil. From the iso-section diagram, it can be observed that there is a preferential orientation phenomenon in both the aluminum plate and the aluminum foil, that is, there is a texture. By comparison, the cold-rolled aluminum plate has {112}<111>, {011}<211>, and {123}<634> textures, while the annealed aluminum foil has {001}<100> and a small amount of {124}<211> textures.
When studying texture, it is also possible to focus on analyzing the orientation distribution on a certain important section. Figure 1.15 captures the φ2, = 45° cross-section diagram in Figure 1.14 (b), and uses formula (1.7) to calculate some important orientations and their related positions on the cross-section diagram, thereby allowing a more detailed observation of the main texture of the aluminum plate and the details of the distribution of the orientation distribution function value.
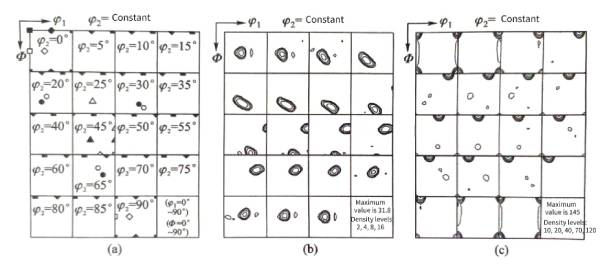 Figure 1.14 (a) Orientation distribution function of high purity aluminum texture, cross-section diagram, (b) rolling, (c) annealing texture
■({001}<100>,◆{001}<110>,Δ{112}<111>,◇{011}<211>,□{011}<100>,■O{123}<634>,●{124}<211>,▲{111}<112>)
 Figure 1.15 Orientation distribution function of deep drawing steel sheet φ2==45° cross section
(■:{001}<100>;◆:{001}<110>;▲:{111}<112>;◇:{011}<211>;口:{011}<100>;Δ:{112}<111>)
In many cases, people do not need to analyze all the data that the orientation distribution function can provide, but only need to analyze the changes in the values of the orientation distribution function on some specific orientation lines in the orientation space during a certain process. Therefore, the orientation distribution analysis can also be simplified to the orientation line analysis. For example, it is found that during the rolling deformation of aluminum plates, the orientations of each grain will gradually converge into the tubular region shown in Figure 1.16 (a), and the center line of the tubular region is composed of the α orientation line and the B orientation line shown in Figure 1.16 (a). Important orientations on the α orientation line include {011}<100> and {011}<211>, etc. [Figure 1.16 (b)], and important orientations on the B orientation line include {123}<634>, {112}<111> and {011}<211>, etc. [Figure 1.16 (c)]. Due to the above-mentioned three-fold rotational symmetry, these orientations and orientation lines will appear twice more in other parts [as shown in the upper half-dotted line area of Figure 1.16 (a)]. It can be seen that analyzing the orientation density on the α orientation line and the B orientation line can simply understand the type and strength of the main texture in the aluminum plate. When analyzing the B orientation line, the accurate values of φ1 and φ corresponding to the B orientation line should also be given, that is, the peak position of the orientation density when φ2 is determined. Figure Figure 1.16(b) and Figure 1.16(c) show the distribution of orientation density on the a-oriented line and the B-oriented line after 95% cold rolling of the industrial pure aluminum plate. Figure 1.16(d) shows the change of the position of the B-oriented line with the angle φ2, from which the exact position of the B-oriented line can be tracked.
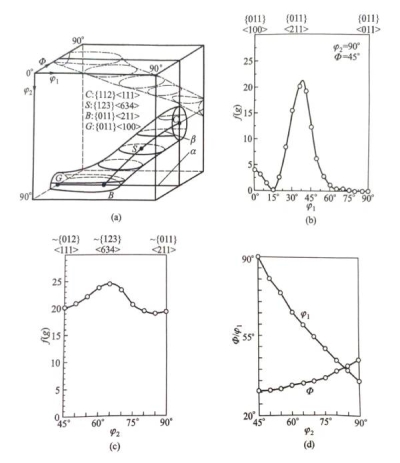 Figure 1.16 Orientation line analysis of 95% cold-rolled industrial pure aluminum plate texture:
(a) α orientation line and B orientation line in orientation space;
(b) Orientation density on a orientation line;
(c) Orientation density on B orientation line;
(d) Position of B orientation line
The above is the explanation of capacitor aluminum crystals-orientation distribution function
4 Capacitor Aluminum Crystals-Calculation of {100} texture occupancy
Whether the {100} plane of each grain in the anode aluminum foil is parallel to the aluminum foil surface has a very important influence on its corrosion performance. The volume percentage of grains with {100} planes parallel to the aluminum foil surface is called {100} texture occupancy, which is particularly important for high-voltage anode aluminum foil. Figure 1.17 is a complete pole figure calculated after measuring the orientation distribution function of a high-voltage anode aluminum foil.
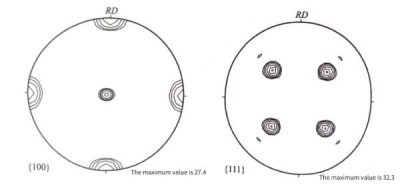
Figure 1.17 Capacitor Aluminum Crystals- shows the pole figure of the texture of high-voltage anode aluminum foil (density levels: 2, 4, 8, 14, 22, 30)
Compared with the pole figure projection principle of Figures 1.10 and 1.11 and the example given in Figure 1.13, it can be found that the aluminum foil shown in Figure 1.17 has a very strong {001}<100> cubic texture, that is, the {100} planes of a large number of grains in the aluminum foil are parallel to the surface of the aluminum foil, and there are very few other non-{001}<100> oriented grains in the aluminum foil. In actual production, it is often necessary to quantitatively detect the occupancy of the {100} texture of the anode aluminum foil.
The quantitative detection method of corrosion pits is currently a common detection standard in China and is widely used. This method is to determine whether the corrosion area is cubically oriented by detecting the square corrosion pits on the surface of the aluminum foil. By determining the degree of deviation of the four corners of the square corrosion pit from 90° and the length difference of the four sides, the degree of deviation of the observed grains from the cubic orientation can be determined in theory, which is of great help in determining the quality of the aluminum foil. Under a 100x optical microscope, the real aluminum foil area of no more than 0.5mm2 can be observed at one time. Low-magnification observation often cannot identify corrosion pits well. If the observation magnification is increased, the actual observation area will be greatly reduced, which can easily lead to the conclusion of 100% or no cubic texture when only one or two grains are observed. Obviously, the statistics and reliability of the results of the corrosion pit method are easily questioned. In addition, it is difficult to quickly give accurate information on the deviation of the texture from the cubic orientation by observing the shape of the corrosion pit with an optical microscope. The X-ray full pole figure quantitative detection method can detect the real aluminum foil area of more than 200mm2 at a time. Even if the corrosion pit method is repeatedly used, it is difficult to achieve the statistics and reliability of the full pole figure method. The full pole figure method can also accurately give the degree of texture deviation from the cubic orientation with good statistics at the same time, so the full pole figure quantitative detection method should be promoted.
The pole figure shown in Figure 1.17 is a full pole figure obtained by measuring multiple incomplete pole figures and calculating the orientation distribution function, and then inversely calculating the pole figure. There is a pole density distribution peak near the center of the {100| pole figure on the left side of Figure 1.17, and it is roughly axisymmetric and normally distributed along α=0°, that is, the ND direction. Referring to Figure 1.12, the data of the {100| pole figure can be expressed in the form of a function p(a, B). If the function is summed along the B direction, we have:
Where ΔB is the step length measured along the B direction. Assume that {100} is parallel to the normal distribution mode PG of the aluminum surface texture.

In a certain range near α=0°, the {100} texture is normally meshed, that is, the S and Oh values that can make p(α) and PG(a) closest are selected using the least squares method; from this, the S0 and 0h values in formula (1.10) can be obtained; finally, the {100| texture occupancy rate, that is, its volume fraction v100, can be calculated.

Wherein, z=3 is the number of non-parallel crystal planes in the {100} crystal plane family of cubic crystals (Table 1.2). The obtained S0is the peak value of the normal distribution function, and 0his the dispersion width of the {100} texture, that is, the {100} texture is reduced from the highest value So when α=00
to the α value when So,e-1
[refer to formula (1.10)]. 0h actually reflects the sharpness of the {100} texture peak. For high-voltage anode aluminum foil, the lower the oh value, the more conducive it is to improve the specific capacitance of the aluminum foil. Calculations show that the occupancy rate v1000 of the {100} texture of the high-voltage anode aluminum foil shown in Figure 1.17 is 96%, and the dispersion width 0h is 6.82°
The above is the calculation of capacitor aluminum crystals-{100} texture occupancy Explanation
Summary:
Capacitor Aluminum Crystals – Aluminum foil is not directly composed of aluminum crystals, but is manufactured through a series of refining, rolling and surface treatment processes. For more information about capacitors, please click:https://capacitorsfilm.com
